The same GPU cloud operator published 3,140 tok/s for the RTX PRO 6000 against 2,987 for an H100, and 2,290.69 against 2,556.03 for the same card on the same model. Nothing is wrong with either number: the first is one GPU at 8K context, the second is eight GPUs at 16K context with tensor parallelism, and the RTX PRO 6000 has no NVLink, so every all-reduce crosses PCIe Gen 5 at roughly 64 GB/s per direction against NVLink 4's roughly 450 GB/s per direction. The card wins single-GPU short-context work and loses multi-GPU long-context work. On purchased-hardware cost per sustained token per second over four years it still leads the H100 in every configuration we modelled, because it costs about 2.3x less per card while losing by at most 1.72x; the card that actually beats it on capex at 8-way tensor parallelism is the H200, not the H100. Order the Server Edition (passive, 1,597 GB/s, up to 600W configurable with a 450W cap option), budget 2 to 4 cards per chassis rather than 8, and re-run any price model at quote time because the card moved 55% in 16 months.
Two numbers dominate the RTX PRO 6000 vs H100 comparison, and both come from the same publisher. In one benchmark the RTX PRO 6000 Blackwell delivers 3,140 tok/s against an H100's 2,987. In another, the same card on the same model delivers 2,290.69 against the H100's 2,556.03. Neither number is wrong. What changed between them is context length (8,192 to 16,384 tokens), GPU count (one to eight), and the parallelism strategy, and that third change is the one that decides the purchase.
Every page currently ranking for this query answers a question you did not ask. They are published by GPU rental operators and price-tracking sites, their cost-per-token figures are all an hourly rate divided by a measured throughput, and every one ends by recommending you rent. That is fine if you have a credit card and a public workload. It is useless if you have a purchase order, a rack with a kW ceiling, and a requirement that the weights never leave your building.
So this post reconciles the contradictory throughput numbers by naming the config each came from, states where the cheap Blackwell card wins and where it stops, and builds a four-year cost model from purchase price, power and PUE instead of from a rental rate. It also covers the procurement facts that decide the order: no NVLink, a 4-way MIG cap, passive cooling that limits you to two to four cards per chassis, and three different RTX PRO 6000 editions that get quoted interchangeably.
What each card actually is
Start with the specifications, because half the confusion in this comparison is people comparing different products. All figures below are from official vendor documentation and a tier-1 server OEM product guide.
Two rows do more work than the rest. The H200 uses the same compute die as the H100, so CUDA core count, Tensor core count and FP8/FP16 tensor throughput are identical between them: the entire H200 advantage is memory capacity and bandwidth. And the L40S has no MIG at all, which removes it from any build where tenants need hardware isolation, regardless of its throughput.
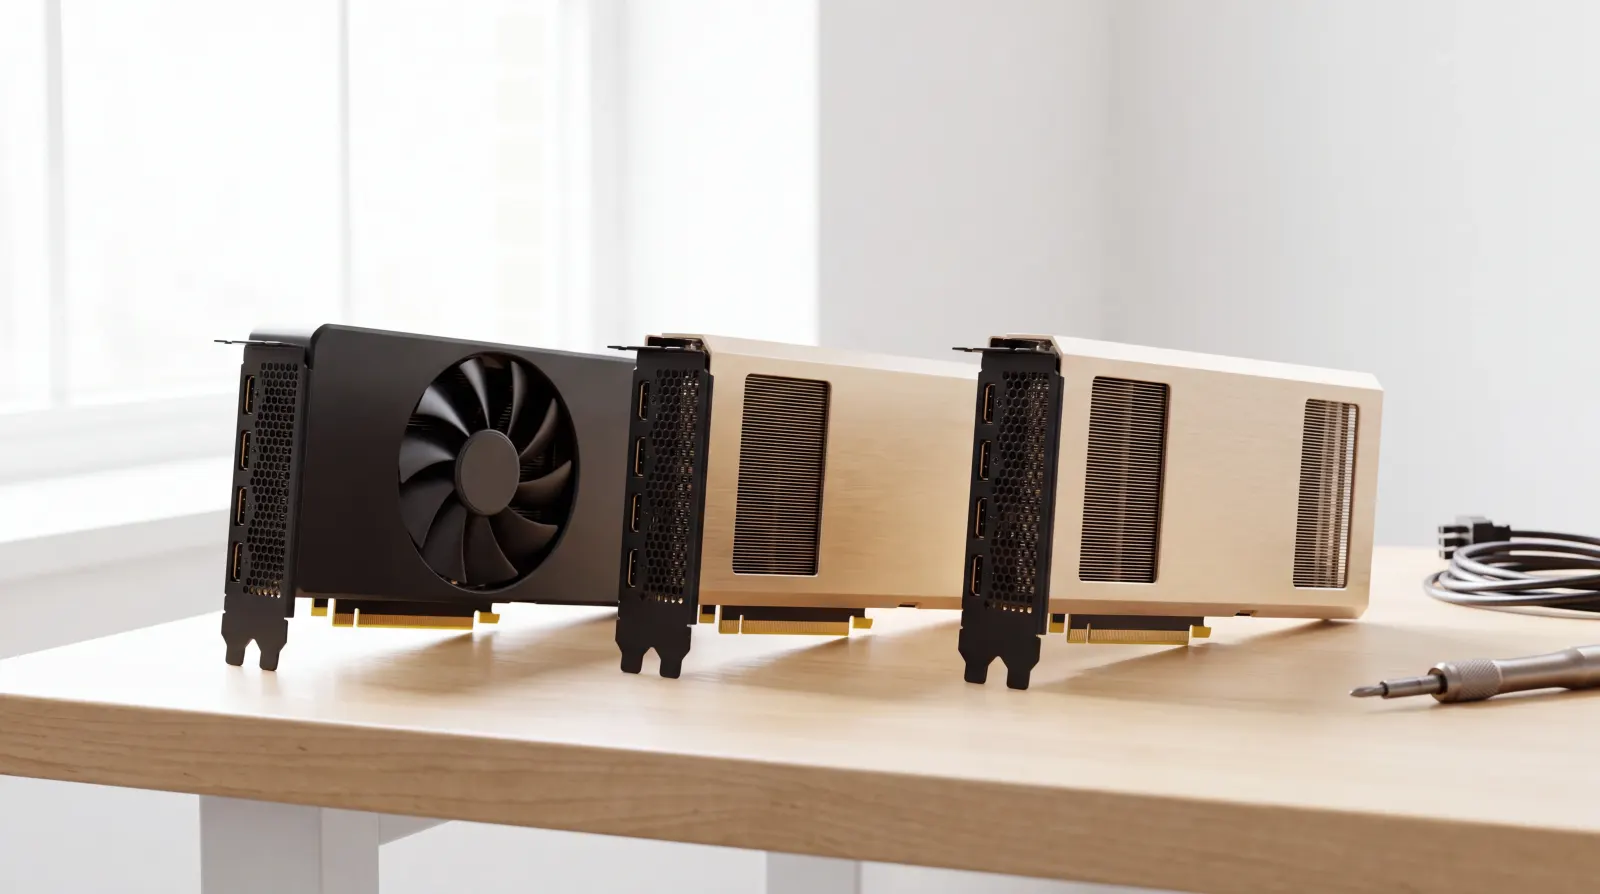
All three carry 96 GB of GDDR7 with ECC in a dual-slot full-height form factor. The Server Edition is the slower-memory bin and a headless Linux part: display outputs are off by default and Windows support was still limited as of mid-2026. If a benchmark you are reading does not say which edition it ran, you do not know its memory bandwidth within 12%.
The three RTX PRO 6000 editions are not interchangeable
Ordering the wrong edition is a real procurement failure, and benchmark posts routinely quote workstation-card results as server-card numbers.
"H100" is three different products
The same ambiguity applies on the Hopper side, and it is worse because sources use it in opposite directions. H100 SXM is 80 GB HBM3 at roughly 3.35 TB/s with NVLink 4. H100 PCIe is 80 GB at roughly 2 TB/s. H100 NVL is 94 GB and is frequently written as "96 GB" in third-party posts. The three benchmarks quoted in this post use three different variants. State the variant every time you state a number, or you inherit the confusion.
| Spec | RTX PRO 6000 Blackwell Server Edition | H100 SXM 80GB | H200 SXM | L40S |
|---|---|---|---|---|
| Memory | 96 GB GDDR7 with ECC | 80 GB HBM3 | 141 GB HBM3e | 48 GB GDDR6 |
| Bandwidth | 1,597 GB/s | ~3.35 TB/s | ~4.8 TB/s | 864 GB/s |
| TDP | up to 600W configurable | 700W | 700W | 350W |
| Interconnect | PCIe 5.0 x16, no NVLink | NVLink 4, 900 GB/s per GPU | NVLink 4, 900 GB/s per GPU | PCIe, no NVLink |
| MIG | up to 4 instances at 24 GB | up to 7 instances | up to 7 instances | none |
| Cooling | passive, chassis airflow | SXM baseboard | SXM baseboard | passive |
| Per 2-socket chassis | 2 to 4 (OEM guide) | 8 via HGX baseboard | 8 via HGX baseboard | varies |
| Edition | TDP | Cooling | Memory bandwidth | Display outputs |
|---|---|---|---|---|
| Workstation | 600W | active dual-fan, flow-through | ~1,792 GB/s | 4x DisplayPort 2.1b, active |
| Max-Q Workstation | 300W | single blower | ~1,792 GB/s | 4x DisplayPort 2.1b, active |
| Server Edition | up to 600W configurable (450W cap option) | passive | 1,597 GB/s | present, disabled by default |
Read the benchmark before you quote it
Here are the published results side by side, with the configuration that produced each one. Every row comes from a GPU rental operator that sells capacity on at least one of the cards involved, so read all of them as vendor self-reports with a commercial interest, not as neutral measurement.
Neither single-GPU headline model is "a 30B model", and describing them that way is the fastest route to losing this audience. GLM-4.5-Air is a mixture of experts with roughly 106B total parameters and about 12B active. Qwen3-Coder-30B-A3B is 30B total with about 3B active. Active parameter count sets decode cost, and the gap between 12B active and 3B active is most of the difference between 3,140 tok/s and 8,400 tok/s.
The last row deserves its own warning. The widely-repeated "1.63x faster than H100" claim is 3,030.01 divided by 1,863.08, which is the Blackwell card at NVFP4 (4-bit) against the Hopper card at FP8 (8-bit). The two cards were also measured on different infrastructure, and the same test reports an H100 time to first token of 1,612 ms against 94 ms, a 17x gap no plausible hardware difference explains. That is an environment artifact. The defensible comparison in that test is the FP8-against-FP8 pair: 2,256.3 against 1,863.08, about 1.21x.
Two more things not to repeat. The "15.8x FP16 gap" headline that spec-diffing sites publish compares the H100's tensor-core FP16 figure against the RTX PRO 6000's vector-class FP16 number. The correct tensor-core comparison is roughly 1 PFLOP peak on the RTX PRO 6000 against 989 TFLOPS dense on the H100 SXM, and even that pair is not symmetric, because the Blackwell figure is a with-sparsity ceiling while 989 is the dense Hopper rate. And the 24,240 TPS figure circulating for the RTX PRO 6000 is a per-server aggregate across multiple VMs at 100 concurrent requests, not a single-card number.
The four-item checklist
Before you quote any GPU benchmark, confirm all four: If the post you are reading does not disclose all four, it is not a measurement, it is a marketing asset. Our guide to setting realistic TTFT and tokens-per-second targets covers how to turn whichever numbers survive that filter into a latency SLO you can hold.
- 1. Which H100 variant. SXM, PCIe or NVL. Different bandwidth, different NVLink topology.
- 2. What context length. The ranking inverts between 8K and 16K on the same model and the same card.
- 3. What concurrency and GPU count. One card at 400 concurrent is a different regime from eight cards at tensor parallelism.
- 4. What numeric format on each side. NVFP4 against FP8 is not a hardware comparison.
| Configuration | Model | Context | RTX PRO 6000 | H100 (SXM unless noted) | H200 SXM |
|---|---|---|---|---|---|
| 1 GPU, 256-512 concurrent, vLLM, FP8 KV | GLM-4.5-Air-AWQ-4bit (MoE, ~106B total, ~12B active) | 8,192 max, 1k in / 1k out | 3,140 tok/s | 2,987 tok/s | not run |
| 8 GPU, tensor parallel | GLM-4.5-Air-AWQ-4bit | 16K (8k in / 8k out) | 2,290.69 | 2,556.03 | 5,463.32 |
| 4 GPU, tensor parallel | Qwen3-Coder-480B-A35B-AWQ | 16K | 1,602.96 | 2,328.63 | 4,262.88 |
| 8 GPU, tensor parallel | GLM-4.6-FP8 | 16K | 1,651.67 | 2,833.77 | 5,587.54 |
| 1 GPU, 400 concurrent, vLLM | Qwen3-Coder-30B-A3B-AWQ (MoE, 30B total, ~3B active) | 1k in / 1k out | ~8,400 | not run | not run |
| 1 GPU, 100 concurrent, NIM + TensorRT-LLM | Llama-3.3-Nemotron-Super-49B-v1.5 | not stated | 3,030.01 (NVFP4) | 1,863.08 (FP8, H100 NVL) | not run |
Where the cheap card stops: the tensor-parallel wall
The RTX PRO 6000 has no NVLink. Every byte of cross-GPU traffic runs over PCIe Gen 5 x16, roughly 64 GB/s per direction. NVLink 4 on the H100 SXM is commonly quoted as 900 GB/s per GPU, which is a bidirectional aggregate, so per direction it is roughly 450 GB/s. Comparing per direction against per direction, the gap is about 7x. You will see 14x quoted elsewhere, which comes from putting PCIe's per-direction figure against NVLink's bidirectional one. Pick a convention and state it.
That 7x lands on one specific operation. Tensor parallelism splits each layer's weight matrices across GPUs, which means an all-reduce at every transformer layer, on every token, for every request in the batch. It is the most bandwidth-hungry pattern in LLM serving and exactly the one PCIe is worst at. The consequence in the table above is monotonic: at 4-way tensor parallelism the RTX PRO 6000 lands at 0.69x the H100, and at 8-way on an FP8 model it lands at 0.58x.
The documented mitigation is pipeline parallelism. Pipeline stages exchange only intermediate activations between adjacent GPUs instead of all-reducing across every GPU at every layer, and that traffic fits inside PCIe comfortably. vLLM's pipeline-parallel scheduler backfills idle stages with queued requests, recovering most of the throughput otherwise lost to bubbles.
# Multi-card serving on cards with no NVLink: prefer pipeline over tensor parallelism.
vllm serve /models/qwen3-coder-480b-awq \
  --pipeline-parallel-size 4 \
  --tensor-parallel-size 1 \
  --max-model-len 16384 \
  --kv-cache-dtype fp8 \
  --gpu-memory-utilization 0.90 \
  --max-num-seqs 256
This changes the tradeoff rather than eliminating the penalty. Pipeline parallelism costs single-request latency (a token traverses every stage sequentially) and buys back aggregate throughput, so it fits batch and high-concurrency serving and fits interactive single-user chat badly. It also stops rescuing you when one pipeline stage no longer fits in 96 GB, at which point you are back to tensor parallelism inside each stage and back on PCIe. For the engine-level decisions underneath this, see our comparison of vLLM, Ollama and TensorRT-LLM and the SGLang versus vLLM breakdown.
Power and rack density: the constraint that is not dollars
Do the arithmetic from card to meter, because in most existing facilities the rack ceiling binds before the budget does. Eight cards at 600W is 4.8 kW of GPU draw before CPUs, memory, fans and PSU losses. At the 450W cap option that integrator documentation lists for density builds, the same eight cards are 3.6 kW. An eight-GPU HGX H100 node is 5.6 kW of GPU draw. Add hosts and losses at a 1.4 PUE and you are at roughly 6.5 to 10 kW at the meter.
# Card watts to annual kWh. Edit the four inputs, run, then check against your facility.
# host_watts is per deployment, so double it when eight passive cards need two chassis.
gpus, watts_per_gpu, host_watts = 8, 600, 800
sustained_fraction, pue, tariff_per_kwh = 0.80, 1.4, 0.12

it_kw = (gpus * watts_per_gpu * sustained_fraction + host_watts) / 1000
facility_kw = it_kw * pue
annual_kwh = facility_kw * 8760

print(f"{it_kw:.2f} kW IT, {facility_kw:.2f} kW at the meter")
print(f"{annual_kwh:,.0f} kWh/yr, ${annual_kwh * tariff_per_kwh:,.0f}/yr")
# 4.64 kW IT, 6.50 kW at the meter
# 56,905 kWh/yr, $6,829/yr
Standard colocation was designed around 3 to 5 kW per rack. High-density facilities treat 10 to 15 kW as baseline and 25 to 30 kW as the AI tier. Air cooling with hot and cold aisle containment runs out somewhere around 40 kW per rack, and uncontained rows lose 20 to 40% of their capacity to recirculation. Fan power scales with roughly the cube of fan speed, so a 10% airflow increase costs about 33% more fan power. Those thresholds come from data centre infrastructure vendors and are directionally sound but facility-specific: check them against your own cabinet.
The passive cooling design adds a constraint watts alone do not capture. A tier-1 OEM product guide lists 4x RTX PRO 6000 Server Edition per one 2-socket platform (using the power-capped variant) and 2x per another. You cannot assume eight cards per box the way you can with an HGX H100 baseboard, so eight RTX PRO 6000 means two or four chassis, two or four sets of CPUs and NICs, and more rack units than the comparison implies. Cap the cards before you build the plan:
# Confirm the configurable range this specific card exposes, then set it.
nvidia-smi -i 0 --query-gpu=name,power.default_limit,power.min_limit,power.max_limit --format=csv
sudo nvidia-smi -i 0 -pl 450
MIG, vGPU and the terms nobody reads until the PO
Multi-tenancy is where these cards separate most cleanly, and it barely appears in the SERP. The RTX PRO 6000 supports MIG with up to 4 fully isolated instances at 24 GB each. The H100 supports up to 7. The L40S supports none.
For a regulated on-premise deployment that count is a design constraint, not a spec-sheet line. Four instances means at most four hardware-isolated tenants or business units per card at 24 GB each, enough for a 7B to 14B model with real context but not for a 70B. Seven instances on an H100 buys finer isolation at 10 GB each, the opposite tradeoff. Zero instances on the L40S means process-level isolation only, which across the finance and healthcare reviews we work through is not an isolation story anyone signs. Where four instances are too coarse or the card offers none, the fallback is a software split, and what MIG, MPS and time-slicing each actually isolate decides whether that split survives the same review.
# Enable MIG and list the profiles this card actually offers.
# Do not copy profile IDs from an H100 guide: they differ per card.
sudo nvidia-smi -i 0 -mig 1
sudo nvidia-smi mig -i 0 -lgip
sudo nvidia-smi mig -i 0 -cgi <id>,<id>,<id>,<id> -C
sudo nvidia-smi mig -i 0 -lgi
The Server Edition is documented for NVIDIA vPC/vApps and RTX Virtual Workstation. One honest caveat: whether an NVIDIA AI Enterprise entitlement ships with the card or must be purchased separately is not something we could confirm, and a 3-year per-GPU E-LTU SKU existing at a major OEM implies separate purchase. Price that line item with your reseller before you finalise a TCO model. If isolation is the reason you are on-premise at all, our comparison of cloud versus on-premise AI on security and cost covers where the boundary has to sit, and confidential GPU inference with TEEs covers what attestation costs on top.
FP4 and FP8 against what your risk team will sign
The RTX PRO 6000's published peak tensor figures are FP4 at 4 PFLOPS, FP8 at 2 PFLOPS and FP16/BF16 at 1 PFLOPS. Treat every one as a with-sparsity ceiling rather than a measured rate. The same applies to the H100's 3,958 TFLOPS FP8 figure, which is the sparsity number against 1,979 dense. Real LLM serving does not reach these. Never put a PFLOPS spec next to a tokens-per-second measurement and imply they are the same kind of claim.
The FP4 throughput advantage also only exists if you actually ship FP4, and whether you can is model-dependent to a degree the vendor framing hides. Vendor-published quantization results put DeepSeek-R1 at 90.8% to 90.7% MMLU moving from FP8 to NVFP4, a 0.1 point loss, with MMLU-Pro moving 85 to 84 on a later checkpoint and differences inside 1% across seven tasks. Independent community measurements on other models are not close: Qwen3-8B at -2.2% MMLU and Gemma3-12B at -4.1% MMLU against BF16.
The dispersion is the finding. A 0.1 point loss and a 4.1 point loss under the same numeric format on the same class of benchmark means there is no general answer to "is NVFP4 lossless", and anyone giving you one is generalising from a favourable model. Quantize your model, run your own eval set at both precisions, and set the acceptance threshold before you look at the result. Decode speedups on this card measured at roughly 163 tok/s under NVFP4 against roughly 61 tok/s at BF16, single-stream, so there is real throughput on the table, but single-stream decode is not the batched-serving regime and you should not plan capacity from it. The same discipline applies one layer down: the measured accuracy cost of FP8 KV cache quantization varies enough between model families that no published table substitutes for a run on your own weights.
Cost per concurrent user over four years, from capex
Every cost-per-token figure in this SERP is an hourly rental rate divided by a measured throughput. For reference, those rates in August 2026 run roughly $1.25 to $4.50 per GPU-hour for RTX PRO 6000, around $2.19 for H100, from $4.41 for H200, and around $0.86 for L40S in a 2x configuration. Useful as a baseline, useless as a purchase decision, because they exclude the things a purchase decision is made of.
Here is the model built the other way. Card pricing as of August 2026: the RTX PRO 6000 Blackwell was listed at $13,250 on NVIDIA's own marketplace, with street listings spanning roughly $11,360 to $16,334. That listing sits about 55% above the card's March 2025 launch price, and a 55% move in 16 months means this table is a worked example of the method, not a quote. Re-run it with your reseller's numbers.
Assumptions: eight GPUs, 80% sustained TDP, 800W of host draw per chassis, PUE 1.4, $0.12/kWh, 48-month straight line, RTX PRO 6000 at $13,250 per card in two 4-card chassis at $25,000 each, H100 SXM at $30,000 per card in one HGX platform at $80,000, H200 at $35,000 per card in the same platform, support at $500 per GPU per year on the RTX PRO 6000 and $1,000 per GPU per year on the Hopper parts. Software licensing is excluded because it is a reseller quote, not a public number.
The power row is the one people get backwards. Eight RTX PRO 6000 draw less GPU power than eight H100, and still cost slightly more to run over four years, because passive cards at two to four per chassis mean two host systems instead of one. Card TDP is not the deployment's power bill.
Read the crossover carefully too, because it is not the one the headlines imply. The RTX PRO 6000 loses the throughput race at 8-way tensor parallelism and still wins on cost against the H100, because it costs about 2.3x less per card while losing by at most 1.72x. For the H100 to win on purchased hardware at these prices it would need to deliver about 1.88x the throughput, and in none of the published configurations does it. The card that actually beats the RTX PRO 6000 on four-year cost per concurrent session at 8-way tensor parallelism is the H200, at 2.39x the throughput for 2.07x the cost.
At single-GPU short-context work the gap is wider still. Amortising one card plus its chassis share, its host power share and its support line, the RTX PRO 6000 lands near $8 per sustained tok/s against roughly $16 for an H100 SXM share, because it wins the throughput comparison and costs less. That is the regime it was built for.
Two things flip this. If rack kW is the binding constraint rather than budget, the H200 delivers more tokens per watt and the comparison changes shape. And if the model does not fit across the cards you can physically put in a chassis, cost per token is irrelevant because the configuration does not exist. Our break-even math on self-hosting versus API covers the layer above this decision, and where to run open-weight models covers the case where the answer is neither.
| Line item (8 GPUs, 4 years) | 8x RTX PRO 6000 | 8x H100 SXM | 8x H200 SXM |
|---|---|---|---|
| GPUs | $106,000 | $240,000 | $280,000 |
| Chassis and platform | $50,000 (2 nodes) | $80,000 | $80,000 |
| Power at meter, 4 yr | $32,000 (2 hosts) | $31,100 | $31,100 |
| Support, 4 yr | $16,000 | $32,000 | $32,000 |
| Total 4-year capex+opex | $204,000 | $383,100 | $423,100 |
| Sustained tok/s (GLM-4.5-Air, 16K, 8-GPU TP) | 2,290.69 | 2,556.03 | 5,463.32 |
| 4-year cost per sustained tok/s | $89 | $150 | $77 |
| Concurrent sessions at 20 tok/s each | 114 | 127 | 273 |
| 4-year cost per concurrent session | $1,781 | $2,997 | $1,549 |
How to pick
The one-sentence version: buy the RTX PRO 6000 Blackwell Server Edition when your model fits on one or two cards and your rack is power-constrained, buy the H200 when you need 4-way or 8-way parallelism at long context, and buy the L40S only when 48 GB and no isolation are genuinely acceptable. The H100 is the card that loses this comparison in 2026, not because it is slow, but because at street pricing it sits between a cheaper card that beats it single-GPU and a faster card that beats it per dollar multi-GPU.
Sizing this properly means running your own models at your own context lengths on cards you can actually get quoted, then dividing by your own tariff and rack budget. That is what Particula Tech's on-premise AI infrastructure work does: we size the deployment against your models and your facility rather than against a rental page, and we say so when the honest answer is fewer cards than you were about to buy. If you are still sizing, our GPU sizing walkthrough for large MoE models under vLLM and the vLLM KV cache OOM guide cover the memory arithmetic that turns a card count into a concurrency ceiling. More on serving and inference economics sits in our LLMs and models pillar.
| Your workload | Buy | Disqualifying constraint on the others |
|---|---|---|
| 7B to 32B, one model, single tenant, up to 32K context | RTX PRO 6000, 1 to 2 cards | H100 costs 2x for less single-card throughput |
| 7B to 14B, mixed graphics and inference, no isolation need | L40S | 48 GB ceiling caps you here; no MIG |
| 70B dense at FP8, single card, moderate concurrency | RTX PRO 6000 (96 GB fits, 80 GB does not) | H100 SXM at 80 GB leaves no KV cache headroom |
| 100B+ MoE, 16K+ context, 4 to 8 GPUs | H200 | RTX PRO 6000 gives up 1.7x to the H100 and 2.4x to the H200 at 8-way TP; H100 costs more per sustained tok/s than both |
| Multi-tenant, hardware isolation required, 4 tenants or fewer | RTX PRO 6000 (4x MIG at 24 GB) | L40S has no MIG at all |
| Multi-tenant, 5 to 7 isolated instances needed | H100 (7x MIG) | RTX PRO 6000 caps at 4 instances |
| Existing 5 kW colocation rack, no facility upgrade | RTX PRO 6000 at the 450W cap, 2 to 4 cards | 8-GPU HGX H100 at 5.6 kW GPU draw does not fit the cabinet |
FAQ
Quick answers to the questions this post tends to raise.